
Getting Started
In this room you will learn how to manually review a web application for security issues using only the built-in tools in your browser. More often than not, automated security tools and scripts will miss many potential vulnerabilities and useful information.
Here is a short breakdown of the built-in browser tools you will use throughout this room:
- View Source - Use your browser to view the human-readable source code of a website.
- Inspector - Learn how to inspect page elements and make changes to view usually- blocked content.
- Debugger - Inspect and control the flow of a page’s JavaScript
- Network - See all the network requests a page makes.
Room: TryHackMe - Walking an Application
Exploring the Website
As a penetration tester, your role when reviewing a website or web application is to discover features that could potentially be vulnerable and attempt to exploit them to assess whether or not they are. These features are usually parts of the website that require some interactivity with the user.
Finding interactive portions of the website can be as easy as spotting a login form to manually reviewing the website’s JavaScript. An excellent place to start is just with your browser exploring the website and noting down the individual pages/areas/features with a summary for each one.
An example site review for the Acme IT Support website would look something like this:
| Feature | URL | Summary |
| Home Page | / | This page contains a summary of what Acme IT Support does with a company photo of their staff. |
| Latest News | /news | This page contains a list of recently published news articles by the company, and each news article has a link with an id number, i.e. /news/article?id=1 |
| News Article | /news/article?id=1 | Displays the individual news article. Some articles seem to be blocked and reserved for premium customers only. |
| Contact Page | /contact | This page contains a form for customers to contact the company. It contains name, email and message input fields and a send button. |
| Customers | /customers | This link redirects to /customers/login. |
| Customer Login | /customers/login | This page contains a login form with username and password fields. |
| Customer Signup | /customers/signup | This page contains a user-signup form that consists of a username, email, password and password confirmation input fields. |
| Customer Reset Password | /customers/reset | Password reset form with an email address input field. |
| Customer Dashboard | /customers | This page contains a list of the user’s tickets submitted to the IT support company and a “Create Ticket” button. |
| Create Ticket | /customers/ticket/new | This page contains a form with a textbox for entering the IT issue and a file upload option to create an IT support ticket. |
| Customer Account | /customers/account | This page allows the user to edit their username, email and password. |
| Customer Logout | /customers/logout | This link logs the user out of the customer area. |
Viewing The Page Source
The page source is the human-readable code returned to our browser/client from the web server each time we make a request.
The returned code is made up of HTML ( HyperText Markup Language), CSS ( Cascading Style Sheets ) and JavaScript, and it’s what tells our browser what content to display, how to show it and adds an element of interactivity with JavaScript.
For our purposes, viewing the page source can help us discover more information about the web application.
How do I view the Page Source?
- While viewing a website, you can right-click on the page, and you’ll see an option on the menu that says View Page Source.
- Most browsers support putting view-source: in front of the URL for example, view-source:https://www.google.com/
- In your browser menu, you’ll find an option to view the page source. This option can sometimes be in submenus such as developer tools or more tools.
TryHackMe provides more information, visit the room to read further!
Viewing the Page Source Walkthrough
It’s time to start locating flags! First deploy the machine…


You should be able to access the web app now.

As the room explains, view the page source.

Right away I identify the new homepage @ /new-home-beta at the top of the source code.

I’ll just grab that…

Paste that next to the IP of the machine IP in the browser, navigating to http://machine-ip/new-home-beta, like below and we have our first flag!

The next question is asking about the secrets page, so look through the source code for something about secrets and you’ll observe:

Grab that and put it in the browser next to the machine IP again as you did above, navigating to http://machine-ip/secrets-page.

Now that you’ve obtained the secrets flag It’s time to complete this section!
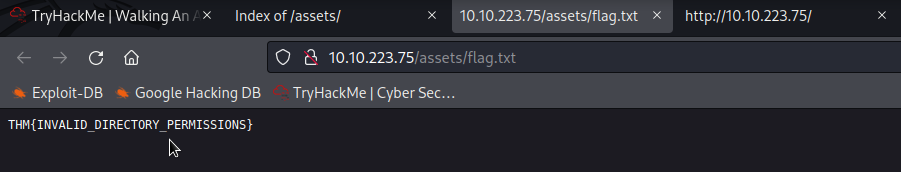
The next question is asking for the directory flag. This one had me think for a moment. I observed the assets directory in the source code, so I figured to poke at it.

As you can see there is flag.txt in this directory. You’ll want to open that up to obtain the flag.
The final question of the section is asking for a framework flag. I recalled seeing this in the notes of the source at the bottom.

Copy and paste into your browser https://static-labs.tryhackme.cloud/sites/thm-web-framework/.
This question required a little more exploring. Check out the Change Log.

Here we can find that a backup process created a file in the web directory called /tmp.zip.

Navigate back to the machine IP, and paste /tmp.zip to download the compressed file.

Navigate to the location where you saved the tmp.zip file to unzip, and read it.

After unzipping the file just use the cat command to output the text contents.
Developer Tools - Inspector
Developer Tools
Every modern browser includes developer tools; this is a tool kit used to aid web developers in debugging web applications and gives you a peek under the hood of a website to see what is going on. As a pentester, we can leverage these tools to provide us with a much better understanding of the web application. We’re specifically focusing on three features of the developer tool kit, Inspector, Debugger and Network.
Opening Developer Tools
The way to access developer tools is different for every browser. If you’re not sure how to access it, click the “View Site” button on the top right of this task to get instructions on how to access the tools for your browser.
Inspector
The page source doesn’t always represent what’s shown on a webpage; this is because CSS, JavaScript and user interaction can change the content and style of the page, which means we need a way to view what’s been displayed in the browser window at this exact time. Element inspector assists us with this by providing us with a live representation of what is currently on the website.
As well as viewing this live view, we can also edit and interact with the page elements, which is helpful for web developers to debug issues.
On the Acme IT Support website, click into the news section, where you’ll see three news articles.
The first two articles are readable, but the third has been blocked with a floating notice above the content stating you have to be a premium customer to view the article. These floating boxes blocking the page contents are often referred to as paywalls as they put up a metaphorical wall in front of the content you wish to see until you pay.
TryHackMe provides more information, visit the room to read further!
Developer Tools - Inspector Walkthrough
It’s time to find the flag behind the paywall. I’m using firefox, so f12 opens the Firefox Developer Tools.
Follow the instructions and navigate over to http://machine-ip/news/article?id=3
Here you will observe, in the developer tools - inspector a div calass=premium-customer-blocker.

In the CSS Styles Box, click on block and type the value none which will reveal the content

The flag here appears to be an image, so I just typed it into the form field.
Developer Tools - Debugger
This panel in the developer tools is intended for debugging JavaScript, and again is an excellent feature for web developers wanting to work out why something might not be working. But as penetration testers, it gives us the option of digging deep into the JavaScript code. In Firefox and Safari, this feature is called Debugger, but in Google Chrome, it’s called Sources.
On the Acme IT Support website, click on the contact page, each time the page is loaded, you might notice a rapid flash of red on the screen. We’re going to use the Debugger to work out what this red flash is and if it contains anything interesting. Debugging a red dot wouldn’t be something you’d do in the real world as a penetration tester, but it does allow us to use this feature and get used to the Debugger.
In both browsers, on the left-hand side, you see a list of all the resources the current webpage is using. If you click into the assets folder, you’ll see a file named flash.min.js. Clicking on this file displays the contents of the JavaScript file.
Many times when viewing javascript files, you’ll notice that everything is on one line, which is because it has been minimized, which means all formatting ( tabs, spacing and newlines ) have been removed to make the file smaller. This file is no exception to this, and it has also been obfusticated, which makes it purposely difficult to read, so it can’t be copied as easily by other developers.
We can return some of the formattings by using the “Pretty Print” option, which looks like two braces { } to make it a little more readable, although due to the obfustication, it’s still difficult to comprehend what is going on with the file. If you scroll to the bottom of the flash.min.js file, you’ll see the line:
TryHackMe provides more information, visit the room to read further!
Developer Tools - Debugger Walkthrough
The instructions directed you to a contact page, so navigate over to *http://machine-ip/contact
I used Debugger in Firefox, click on the flash.min.js file, and at the bottom of Debugger click on Pretty print source.

Now you should be able to follow along with the instructions and insert a breakpoint.
For me the breakpoint was at line 108. It’ll turn blue when the breakpoint is inserted.

Now refresh the page.

Your flag should appear!

Nice work, onto the next section!
Developer Tools - Network
The network tab on the developer tools can be used to keep track of every external request a webpage makes. If you click on the Network tab and then refresh the page, you’ll see all the files the page is requesting.
Try doing this on the contact page; you can press the trash can icon to delete the list if it gets a bit overpopulated.
With the network tab open, try filling in the contact form and pressing the Send Message button. You’ll notice an event in the network tab, and this is the form being submitted in the background using a method called AJAX. AJAX is a method for sending and receiving network data in a web application background without interfering by changing the current web page.
TryHackMe provides more information, visit the room to read further!
Developer Tools - Network Walkthrough
The instructions keep us at the contact page, so navigate over to *http://machine-ip/contact if you aren’t already there.
Now we want to send a message while observing Network in Firefox Developer Tools.
F12 > Network
I added some filler information into the form and clicked Send Message.

An event shows up in the network tab. This is the form being submitted through a method called Ajax.
A file contact-msg appears.

Open that file to retrieve the final flag.

Credit
This is a free room, which means anyone can deploy virtual machines in the room (without being subscribed)! 98226 users are in here and this room is 427 days old at my time of writing this.
Created by: tryhackme
This room is part of the Jr Penetration Tester learning path.